Precision, recall, and F-score
A very important measure of performance of classification algorithms is accuracy: given a sample of items to classify, how many did the algorithm classify correctly? In this post, we will discuss this issue specifically with accuracy of binary classifications, i.e. those with two labels.
As an example, suppose you have a machine that detects a type of cancer. Given a patient’s data, the machine is supposed to return negative if it deems the patient cancer-free, and positive if it deems the patient having cancer. You are given 35 patients, of whom 10 actually have cancer, and 25 are actually cancer-free. However, the machine is faulty and always returns negative regardless of whether or not a patient has cancer. Then it would correctly classify all the 25 cancer-free patients, but incorrectly classify the 10 cancer-carrying patients (which is a harmful performance). We can roughly say that the machine’s accuracy is , but this number fails to capture the fact that the machine is incapable of identifying cancer-carrying patients. If we are mostly interested in detecting cancer-carrying patients, then despite its relatively high raw accuracy, the machine is actually useless.
A better measure of accuracy here is the F-score. An F-score is an “average” of two separate measures of accuracy, namely precision and recall. We will dissect these concepts using the above example and a couple of diagram.
To illustrate these concepts, suppose our machine has been fixed, so now it can return positive as well as negative.
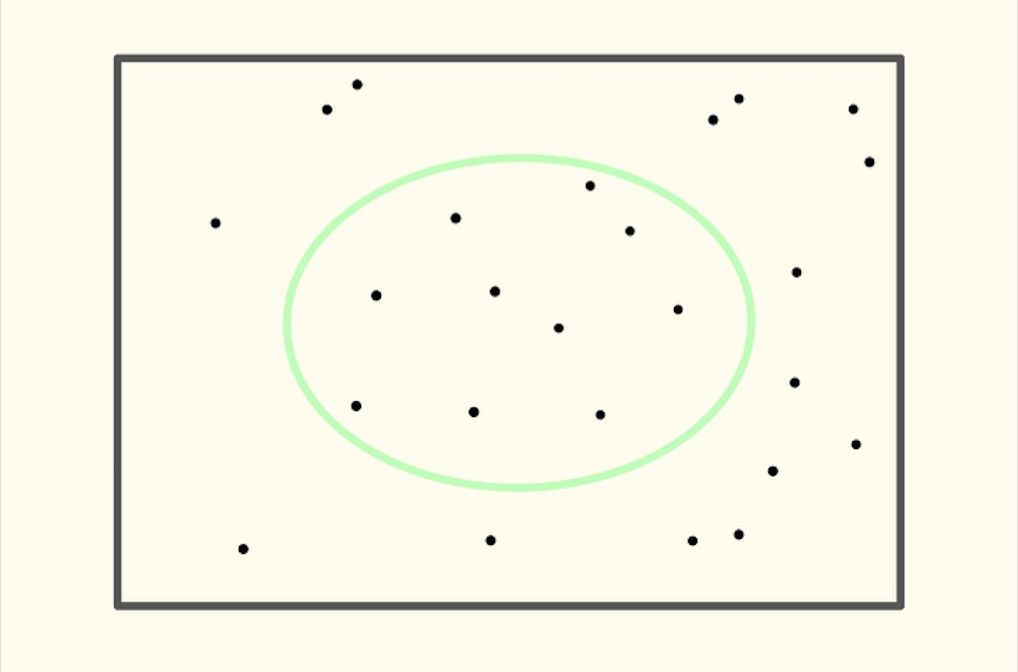
In the following diagram, the dots inside the square represent all the patients. The circle in the diagram contains those patients for whom the machine deems cancer-carrying; those outside were diagnosed by the machine as cancer-free.
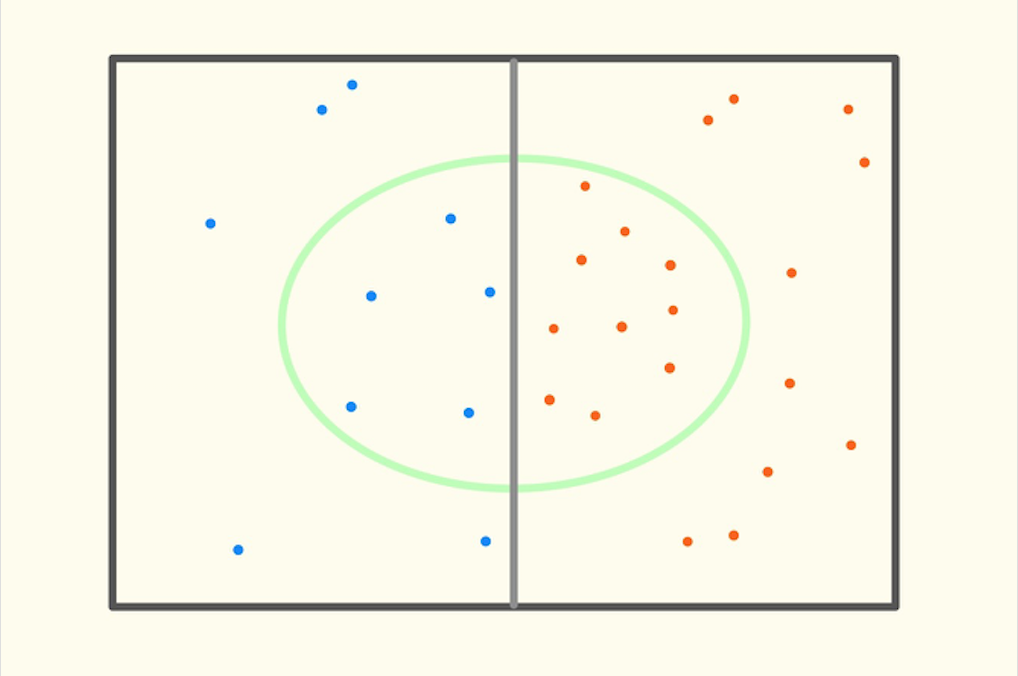
Then we add more details in the diagram below. The left rectangle contains those who actually carry cancer, and the right rectangle contains those who actually are cancer-free. Note how the circle overlaps with the rectangles, so those outside the cirle in the left rectangle were incorrectly diagnosed as cancer-free, and those inside the right-half of the circle were incorrectly diagnosed as cancer-carrying.
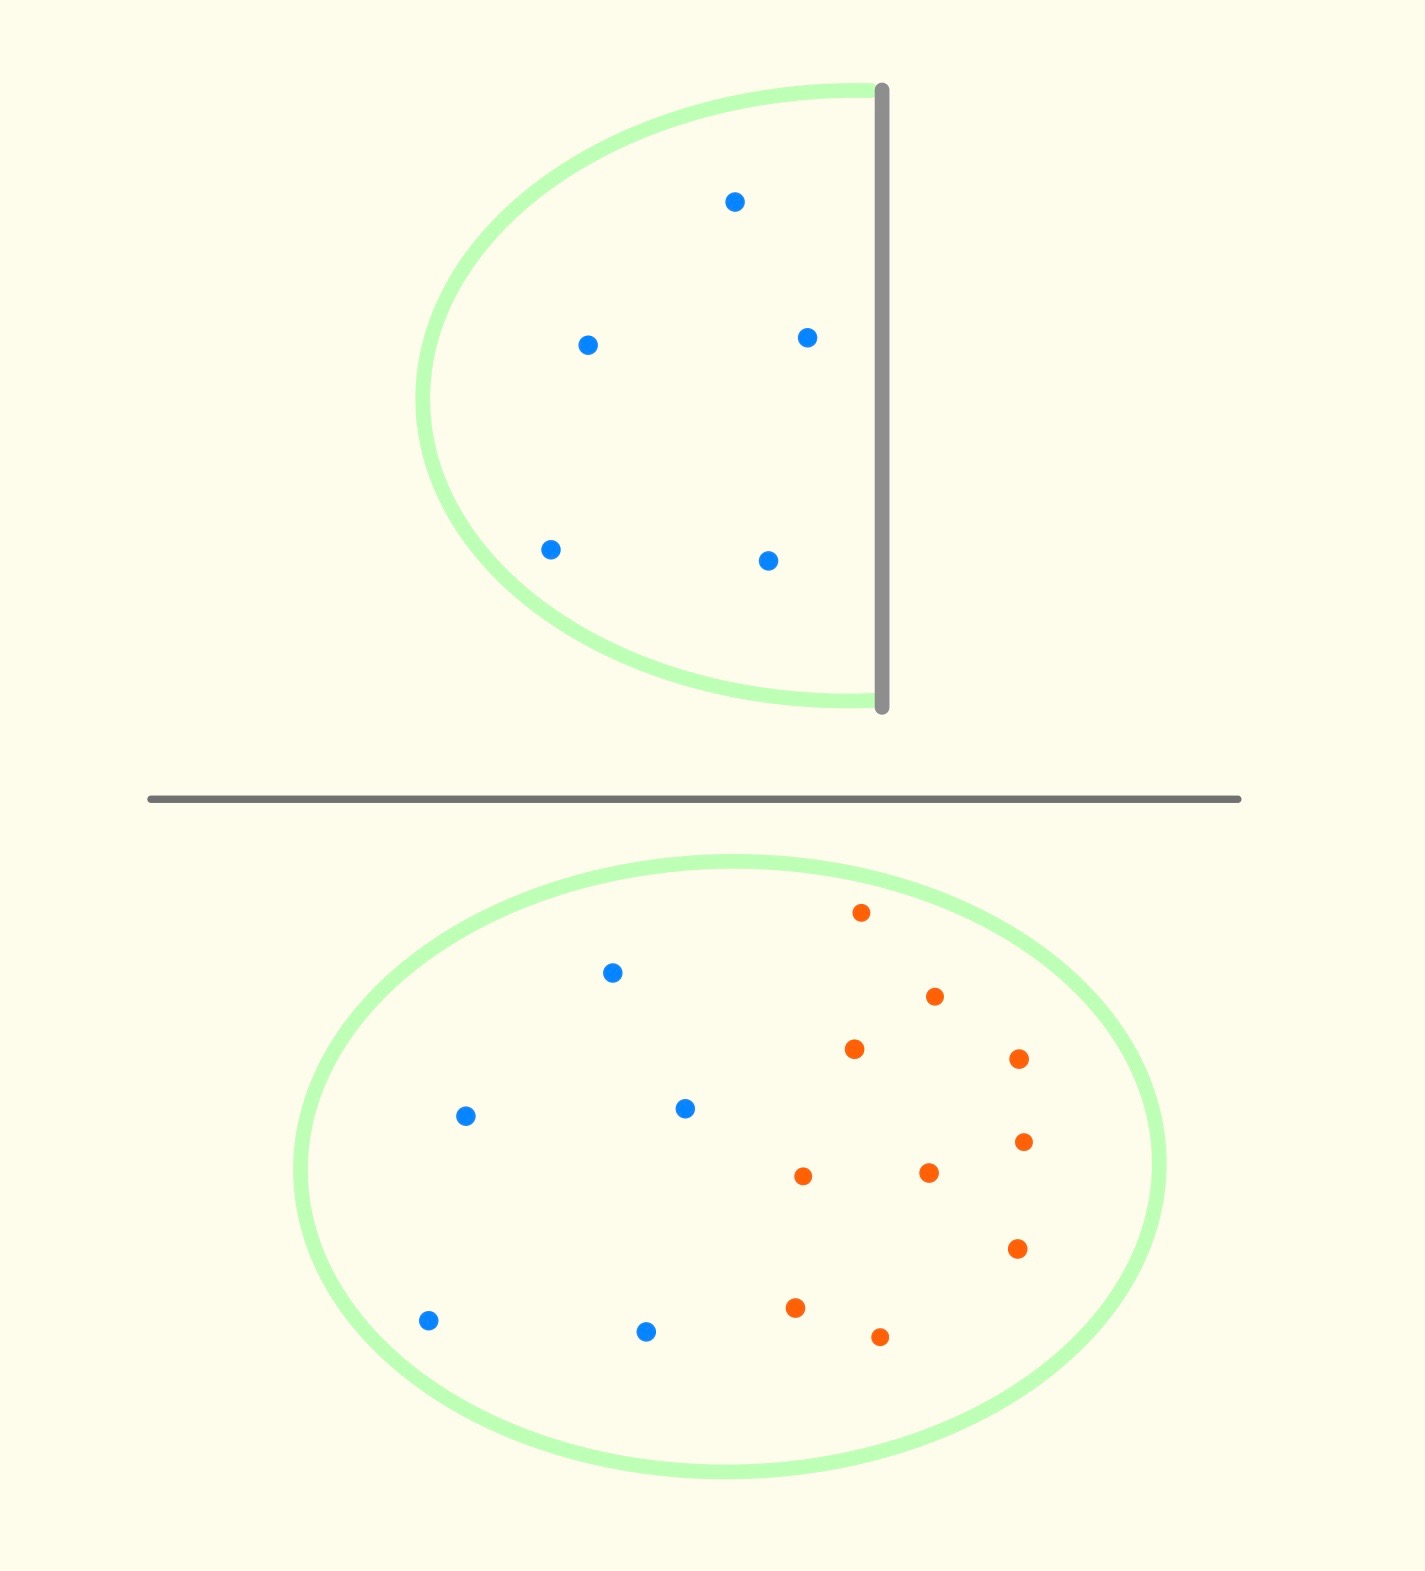
Precision answers the question: what proportion of positively-diagnosed patients are actually cancer-carrying? From the diagram above, precision would be . This is the number of patients that were positively-diagnosed and actually carry cancer, divided by the number of patients that were positively-diagnosed. Visually, precision can be represented by the following diagram:
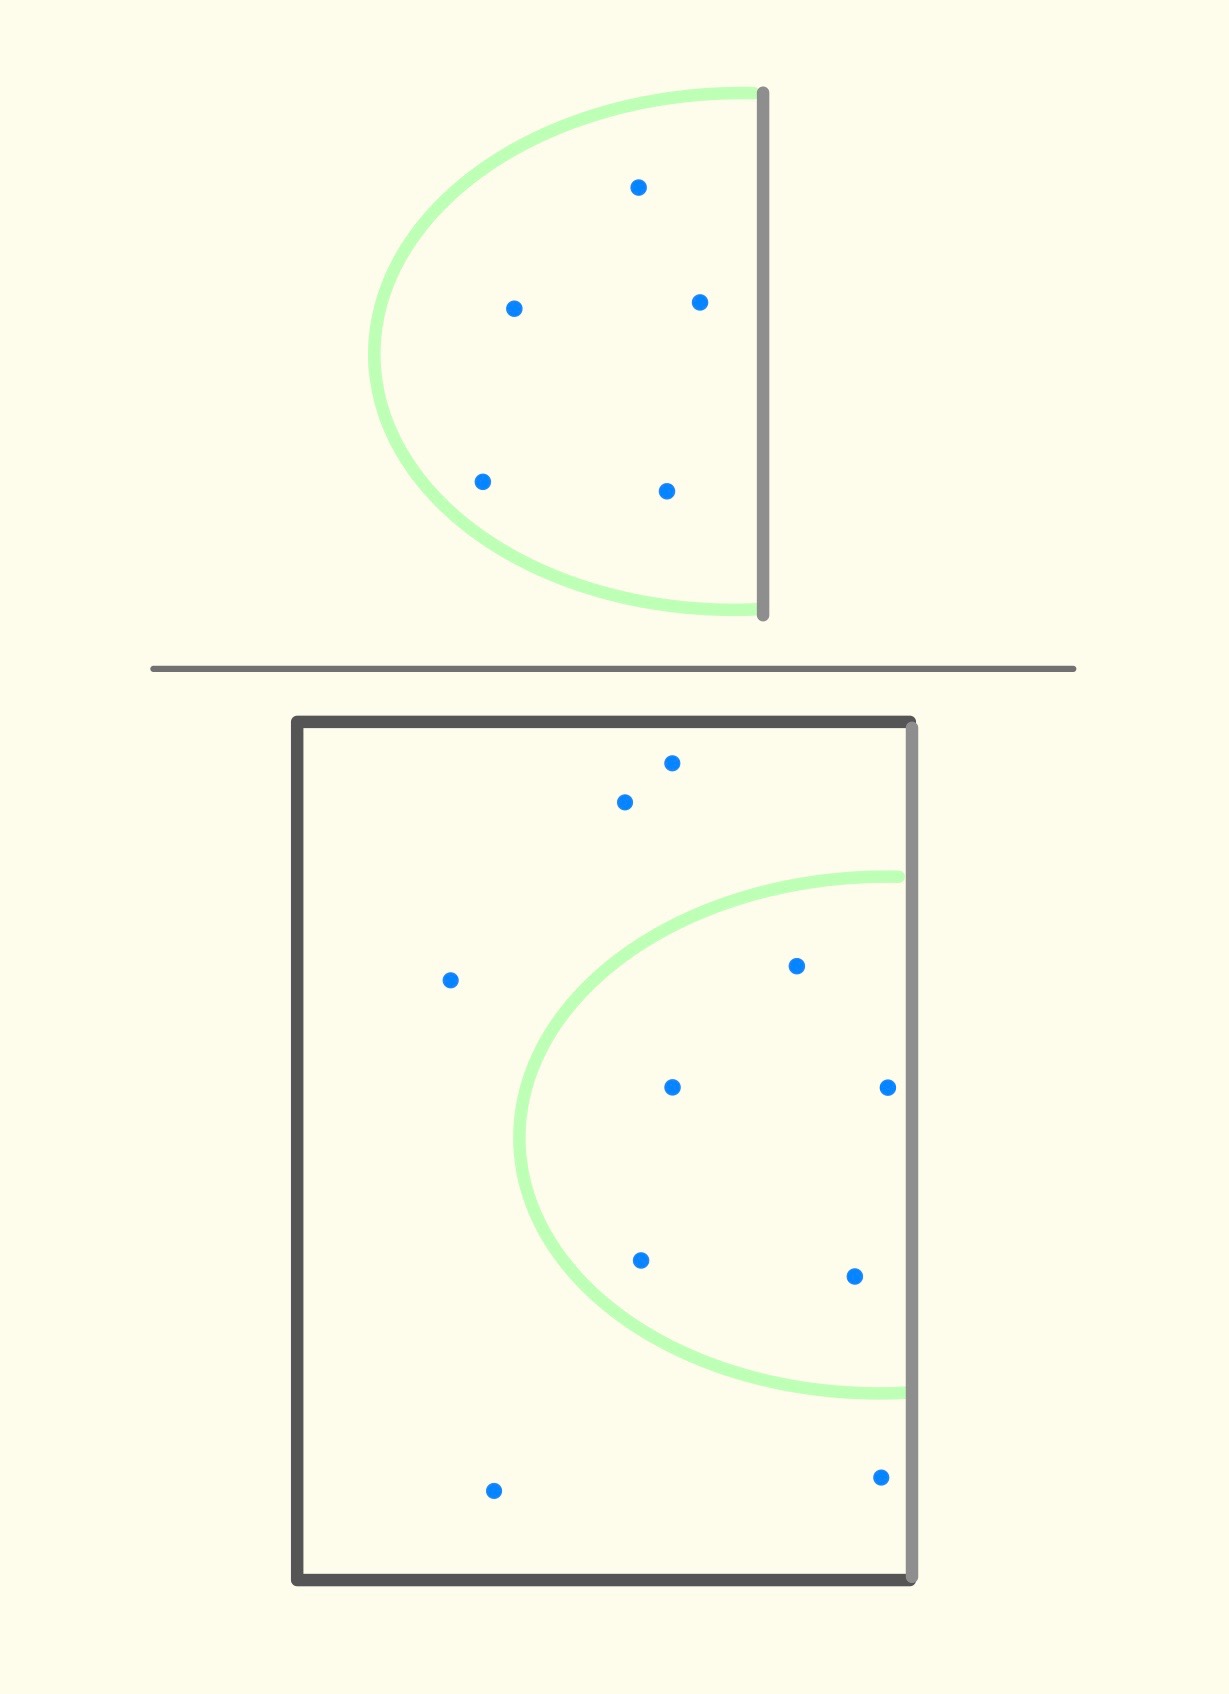
Recall answers the question: what proportion of patients who actually carry cancer were diagnosed as having cancer? From diagram 2, recall would be . This is the number of patients that were both positively-diagnosed and actually carry cancer, divided by the number of patients who actually have cancer. Visually, recall can be represented by the following diagram:
You see, precision gives a measure of how accurate the machine’s classification is, with respect to the relevant label (cancer-carrying). Higher precision means that when the machine says a patient has cancer, the probability that the patient actually has cancer is higher. The machine’s positive classifications are therefore more trust-worthy.
Recall, on the other hand, gives a measure of how well the machine is able to identify cancer-carrying patients. Given the same sample of patients, a machine with higher recall would be able to detect more cancer-carrying patients than does a machine with lower recall.
To generalize, we use the following terminology: selected means the classified label that you care about (in our example, the “selected patients” are those positively-diagnosed by the machine), relevant means the actual label that you care about (in our example, the “relevant” patients are those who actually have cancer). So we have the following general formulae:
To summarise these two measures in one single number, naturally, we use some kind of average (or mean). Because precision and recall are proportions, it does not make sense to use arithmetic mean or geometric mean. Harmonic mean is the most appropriate way to take average of ratios, so the F-score is the harmonic mean of precision and recall. Here is the formula:
In the above formula, precision and recall contribute equally to the F-score. This equal-weighting F-score is commonly referred to as F-1 score. In practice, depending on which of precision and recall is more important to your measure of accuracy, you may want to give more weight to the more important component. The F-2 score weighs recall higher than precision, and F-0.5 score weighs precision higher the recall.
While F-scores are better than raw accuracy ratio, they do have some drawbacks. Most importantly, they do not take into account correctly-labeled-negative examples, so they are actually biased measure of accuracy. A classification algorithm that classifies negative examples better than positive examples, then, would appear to be performing more poorly than it actually is, if we look at only its F-score. Conversely, a classification algorithm that handles positive examples better than negative ones, would appear to perform better than it actually is, by virtue of only its F-score.